Reports
Through the Reports menu on your Admin Panel, you can track all activities on your storefront and access essential reports to review the performance of your B2B portal. These reports allow you to monitor your company’s growth, see which products are performing well and which are not, track your sales reps’ performance, and get valuable insights on how to grow your company.
This article will present the reports available on your B2B Wave eCommerce platform.
Sales Reps Performance
This report allows you to monitor your sales reps’ performance and the total number of orders they submitted, the average order value, the total value of their orders, and the commission due for each of them. Specifically, you can access and personalize this report, review the orders facilitated by each of your sales reps, and filter them by sales rep, order status (e.g., Submitted, Invoiced), or a specific date range.

Finally, for a more detailed overview of your sales reps’ orders, you can check the “Show Breakdown” option.

Customers Performance
This report presents an overview of customer activity on your B2B portal. It includes information on the number of orders customers have placed, their average order value, and the total sum of their order value. You can also generate drilled-down reports based on order status, specific date range, sales reps, and customer company activity (e.g., Retailer).

Customer Activity
This report displays the products and categories your customers browse or view through your B2B storefront. You can generate the report for a specific date range and look up individual customers. Filters are available by search type (e.g., product, category) and customer actions, such as viewing specific products or categories, searching for particular products or categories, or browsing products through your digital PDF catalog. Also, you can track which products customers attempted to order, but couldn’t because these weren’t available or exceeded current stock levels.
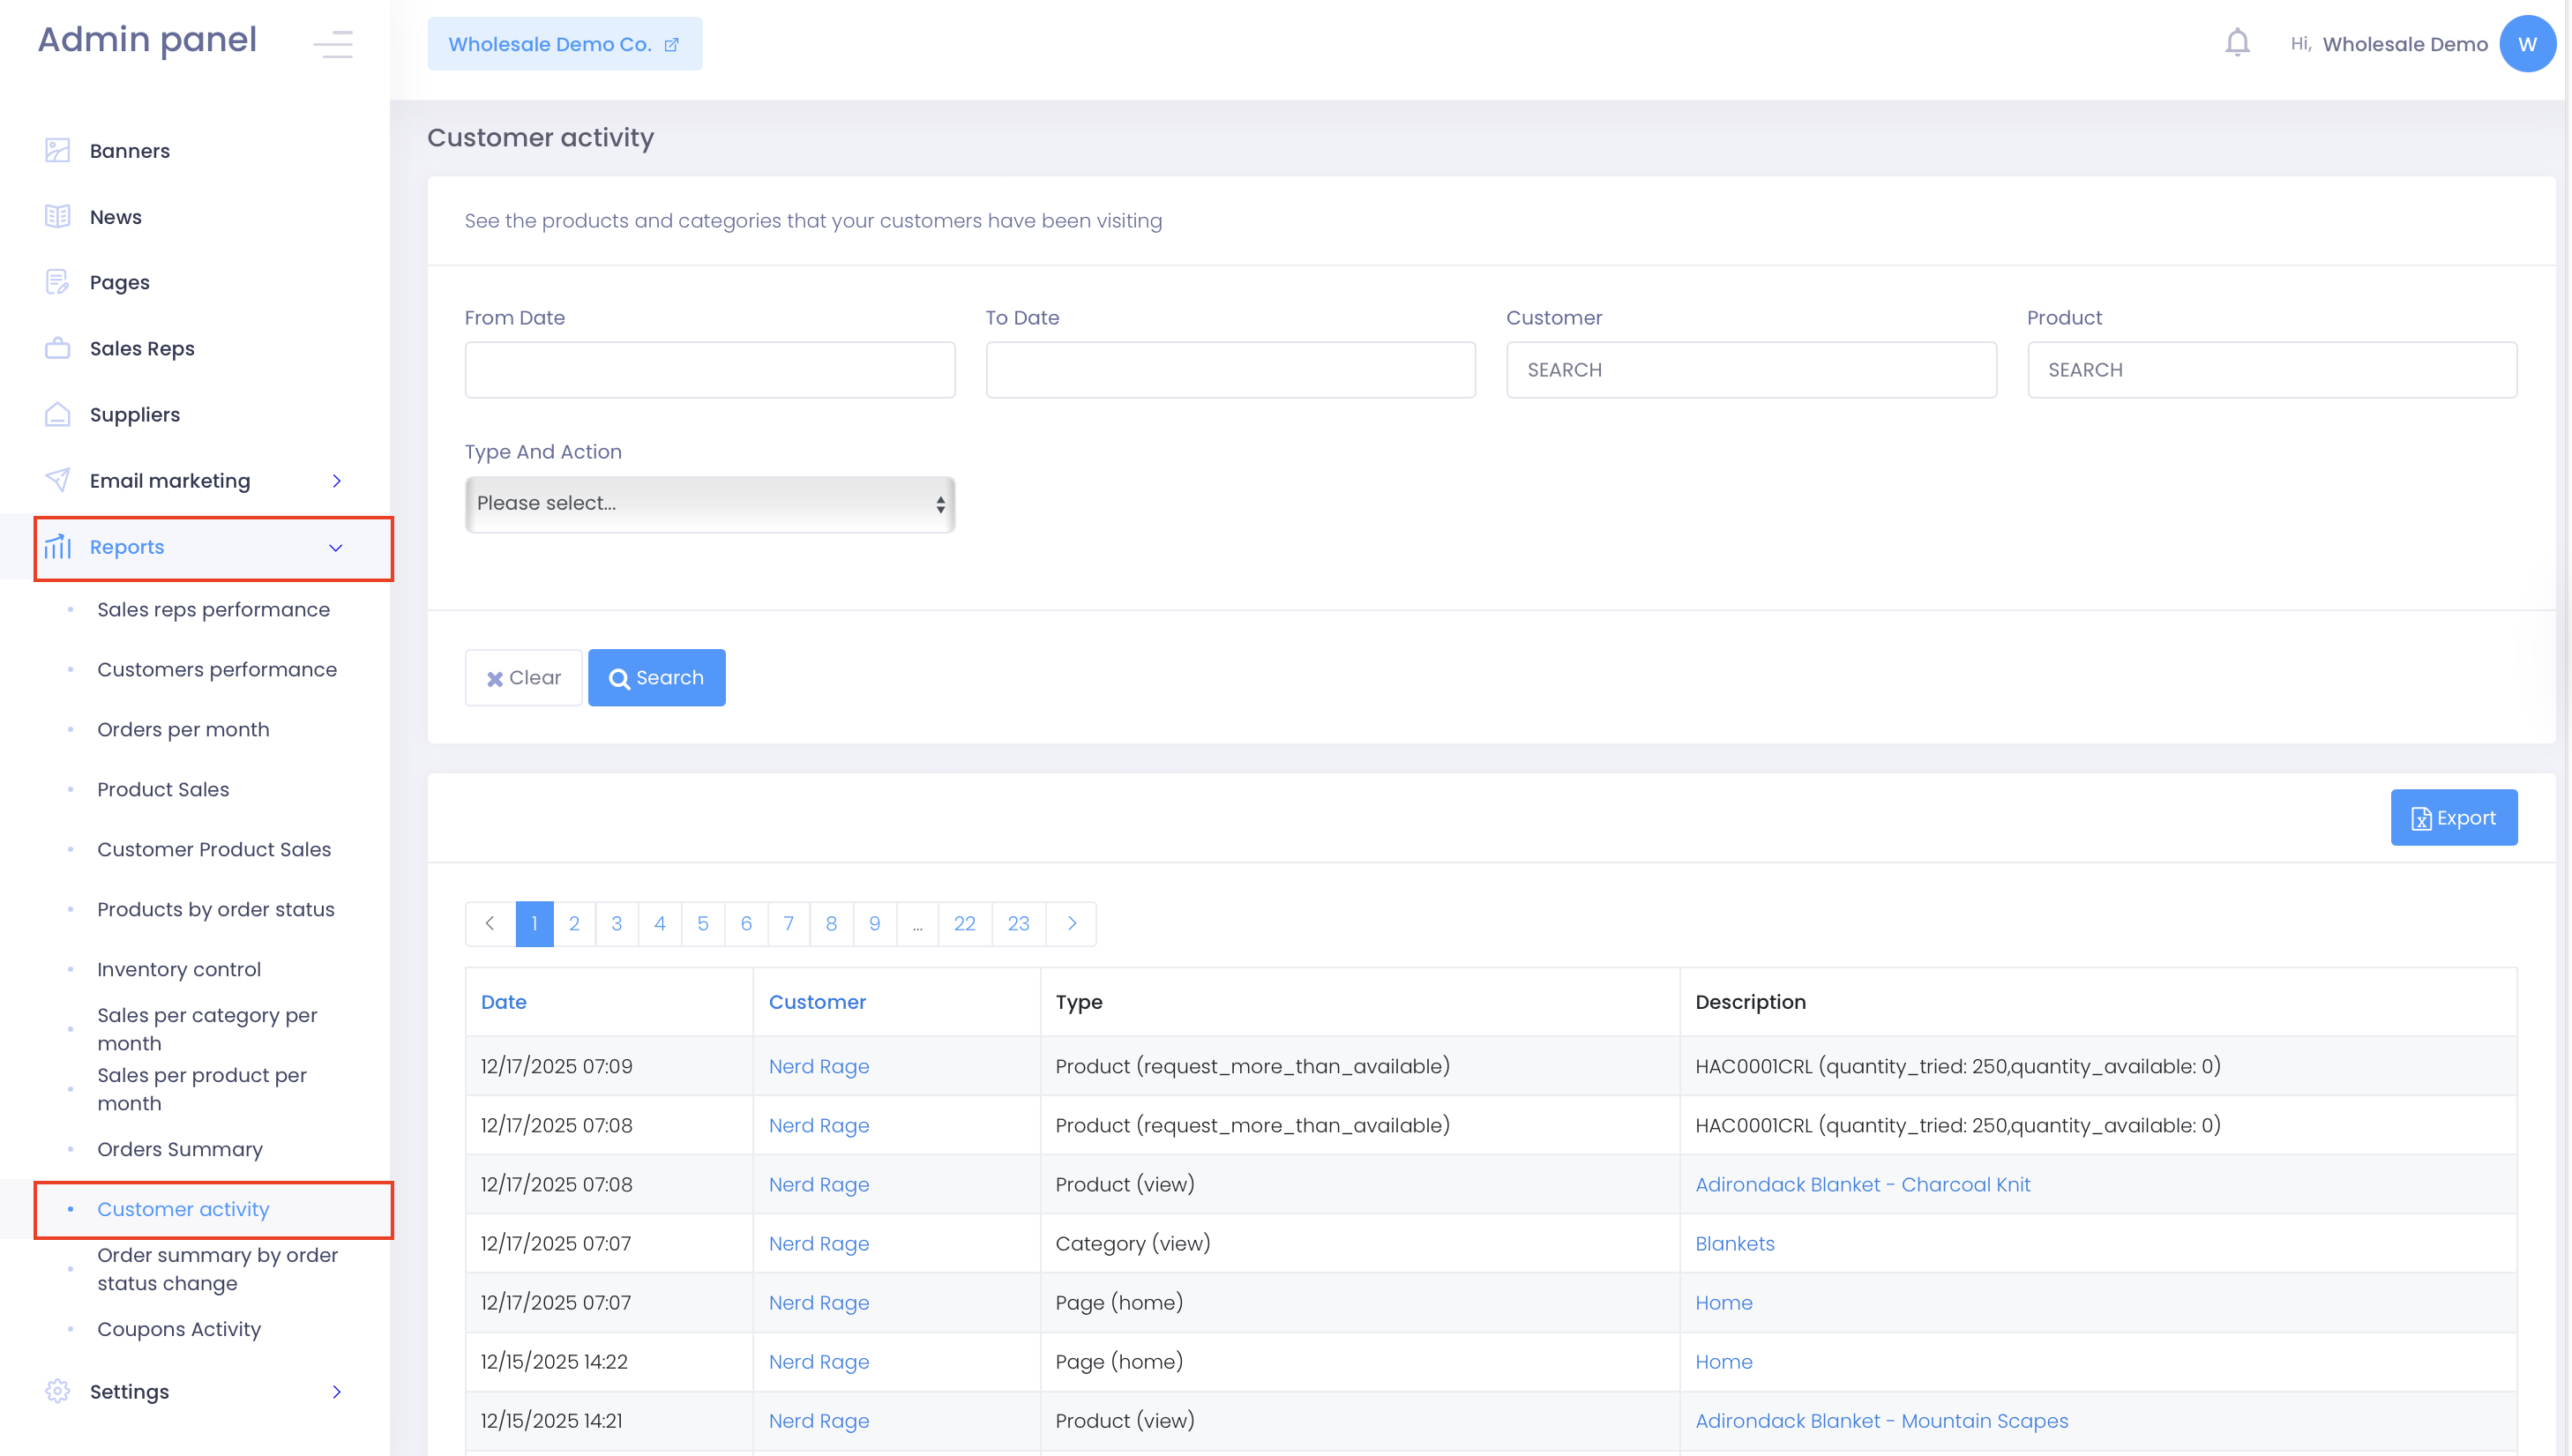
NOTE: Contact our support to enable this report for your account. It displays data from the last seven (7) days by default. To extend the data range, please contact our support team.
Orders per Month
This report provides an overview of the volume of orders submitted through your B2B portal, including a breakdown of received orders per year and month, the corresponding number of orders, and the sum of their value.

NOTE: Remember that you can click “Export” to download each report in Excel format.
 Product Sales
 Product Sales
 With this report, you can see the total quantity of each product you have sold through your digital portal, including information on product brand, if applicable, product code/SKU, product name, and the total value of product sales and their currency. You can also generate this report for a specific date range, delivery date range, product category or subcategory, customer, price list, sales rep, order status, brand, and privacy group. You can also include unsold products or product variants in your personalized report.

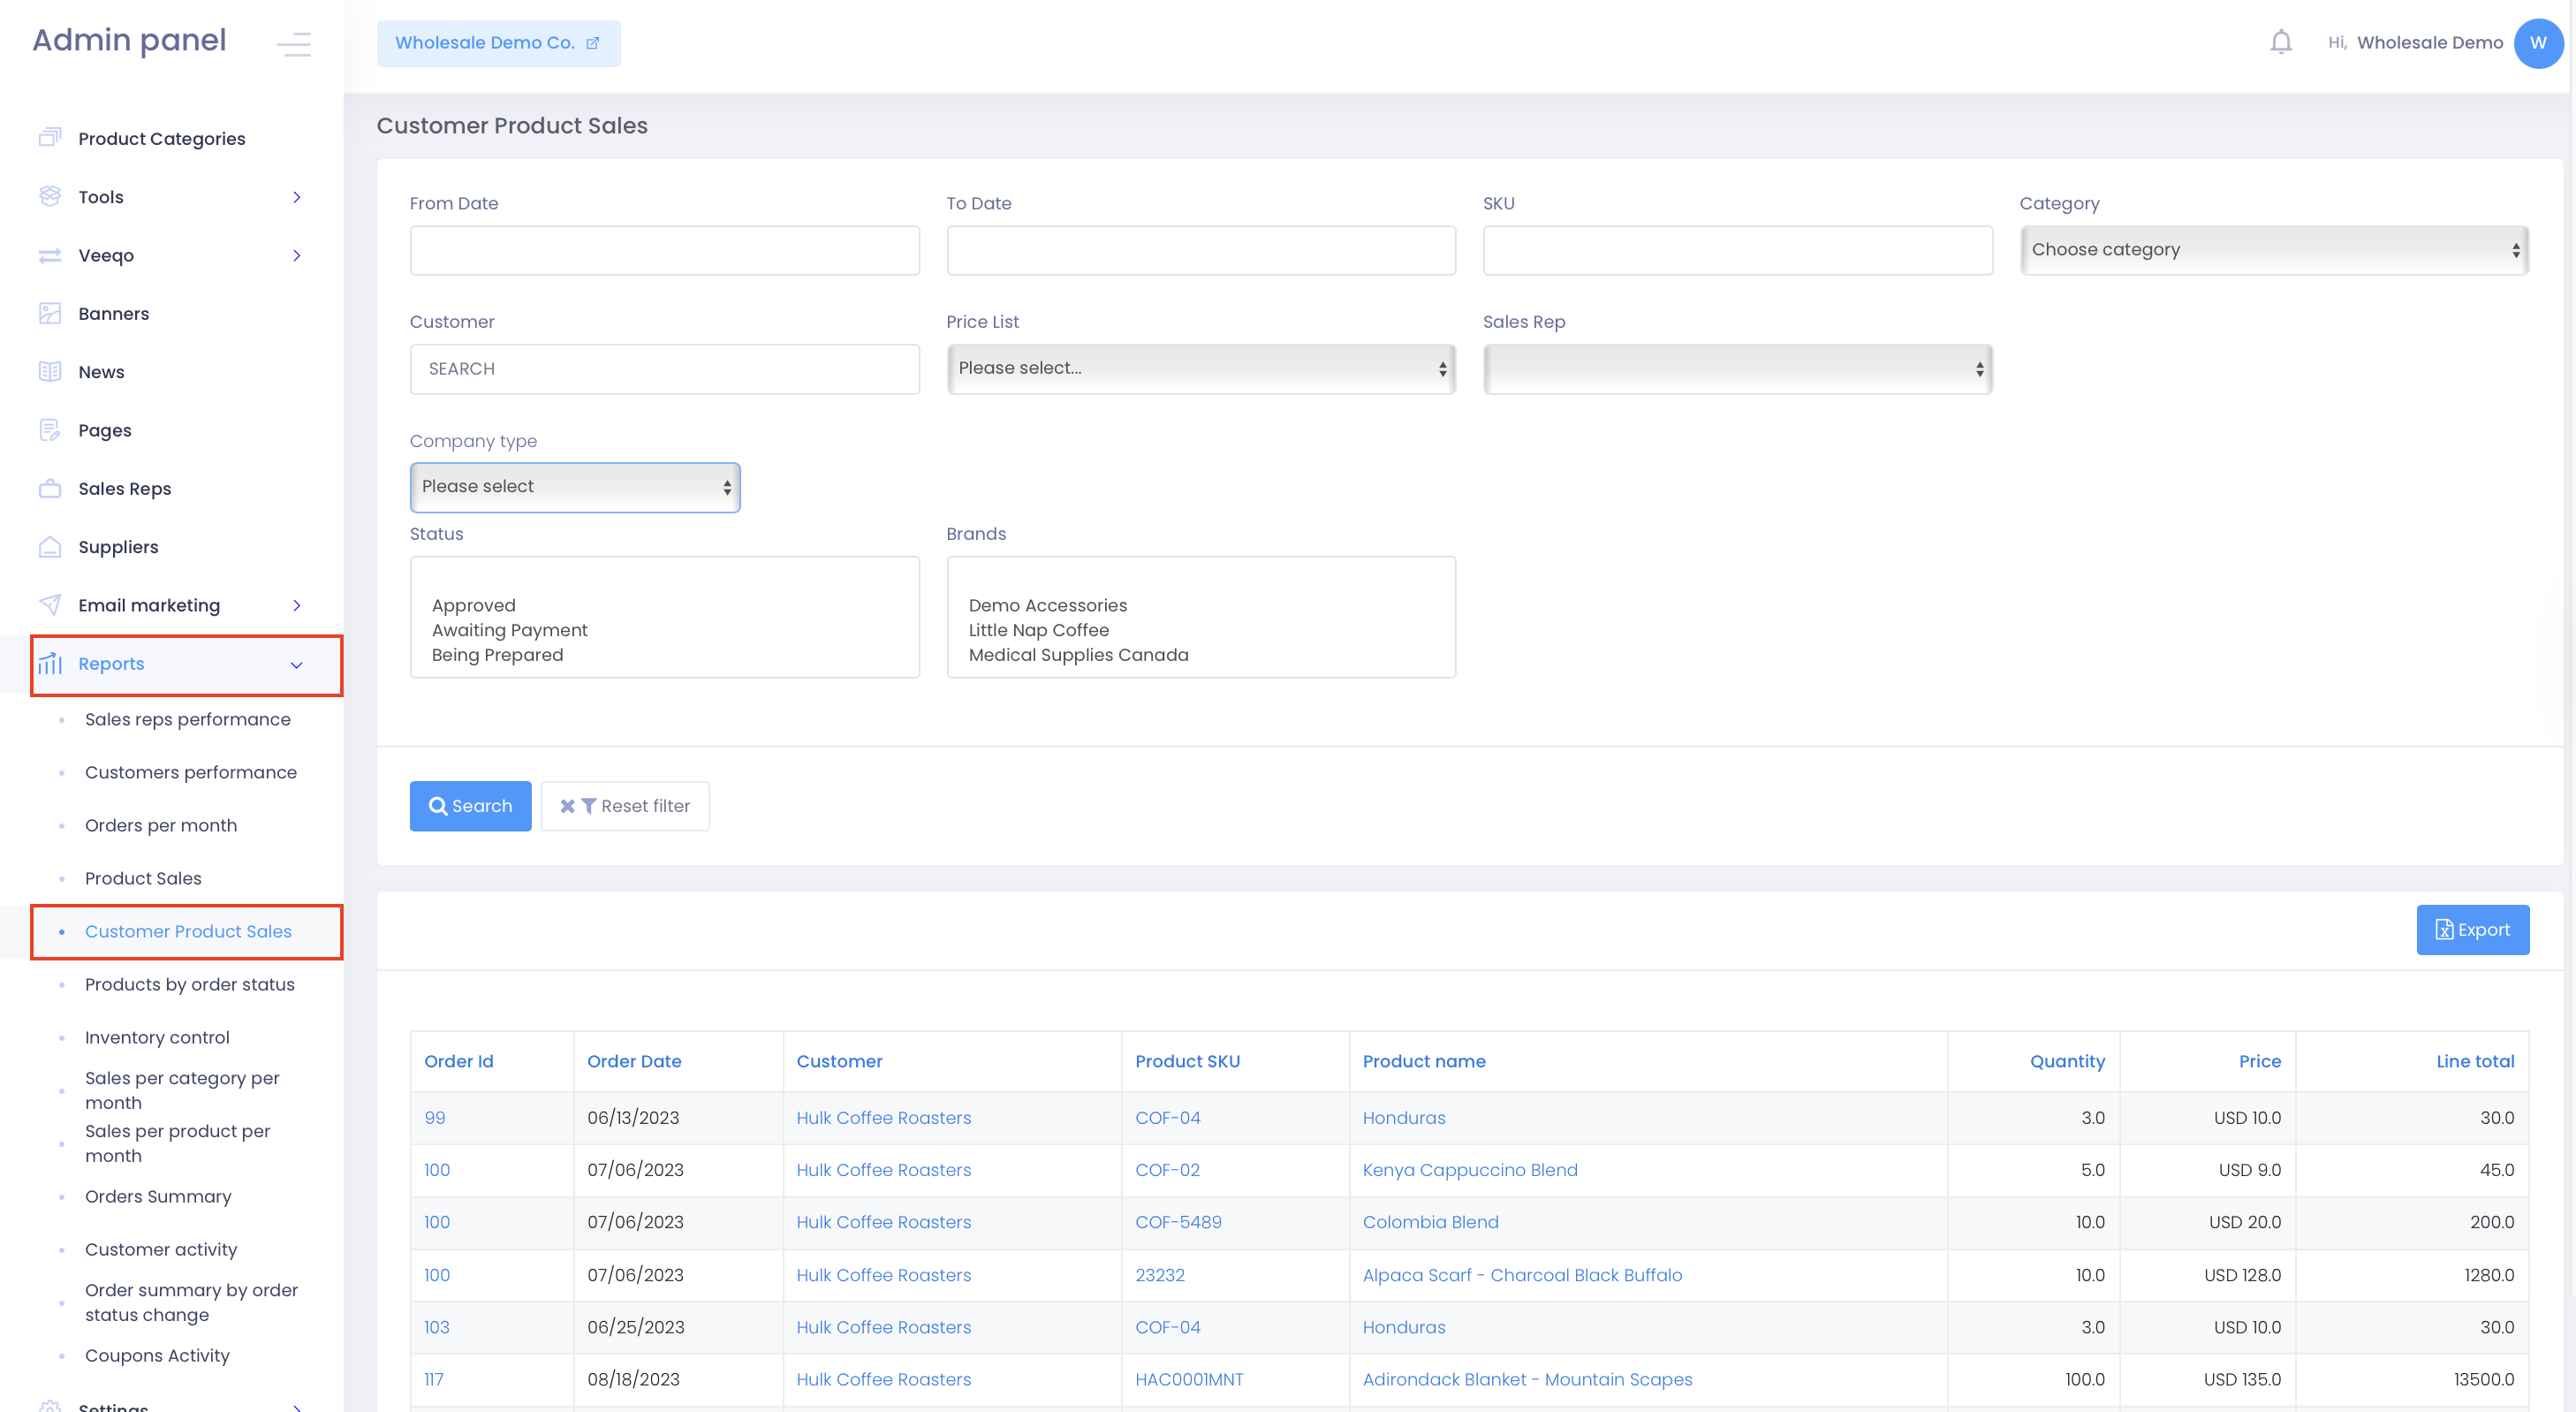
Customer Product Sales
This report provides a breakdown of product sales per customer, including each order’s B2B Wave identification number, order date, customer name, product code/SKU, product name, ordered quantity, price, and the total value of ordered products. You can filter this report for a specific date range, delivery date range, product SKU, product category or subcategory, customer, price list, sales rep, order status, and brand. Also, you can use select or multi-select customer extra fields as filters in this report. To add customer fields as filters, please contact our support team.
Products by Order Status
This report allows you to review product performance based on order status. Specifically, you can access information about each ordered product’s SKU, name, order ID, order status, submission date, and ordered product quantity.
 In addition, you can filter this report based on a specific order status, product name, and code. Finally, check the “Show sum” option to get a breakdown of the total number of orders a product has been included in and the complete order quantity per product status.

Inventory Control
This report allows you to monitor your inventory and track product quantity per product code/SKU and name, including information on product cost, sold and available quantity, and sold and inventory value. Also, you can filter per product category and subcategory, product name, code, or minimum quantity threshold.
NOTE: To enable inventory management for your account, go to Settings >Profile >Application configuration and check the “Manage stock levels” box.

Low Quantity
This report returns a list of products whose stock is low, based on the low quantity threshold you have set for your B2B store through Settings >Profile >Application configuration. In addition, the report presents an overview of the quantity threshold and available quantity per product code/SKU and name. Products for which you have allowed backorder will also appear here as negative values under the “Available Quantity” column.

Sales per Category per Month
This report lets you monitor how product categories and subcategories’ sales perform monthly. To generate it, click the appropriate category or categories from the menu, then click “View report.”

Sales per Product per Month
This report allows you to track product sales performance monthly. To generate it, type the product’s name or code in the relevant field and click “View report.”

Order Summary
This report showcases a summary of all orders customers have placed through your B2B store. Specifically, you can access information about each order based on their order ID, date, corresponding customer, country, currency, net value, Sales tax/VAT value, total order value, payment method, and order status. Also, you can generate this report for a specific date range according to the order submission or payment date. Also, you can filter orders per payment option, company, country, and order status.
 Order Summary by Order Status Change
 Order Summary by Order Status Change
With this report, you can review orders based on their order status. Specifically, you can access information about each order based on their order ID, date, corresponding customer, country, currency, net value, Sales tax/VAT value, total order value, payment method, and order status. In addition, you can generate this report for a specific date range according to the order submission date, payment date, and order status change date. Also, you can filter orders per payment option, company, country, and order status.

Coupons Activity
This report presents the performance of discount coupons, including information on the coupon’s code, the date it was created, the times customers used it, the coupon discount percentage and amount, the total order value before and after the discount, and the total coupon discount value. You can use filters to apply to review a specific date range and opt to see a coupon performance summarized or in detail. The detailed version of the report includes additional information, such as the relevant orders’ IDs, submission dates, and customers.
